Review Token Usage
Use Monitor > Tokens to see what your AI agents spend and where that spend comes from. The page has three views: Dashboard, Analytics, and Optimize. All three views use the same date range and the same filters.
Set the date range
The controls in the page header set what data every view shows:
- 7d, 30d, and 90d presets, or an explicit Start and End date.
- Filters, which let you narrow the results by User, AI Agent, MCP Server, and Tool.
The Optimize tab shows a badge. The number in that badge is how many items are waiting for you to act on.
Dashboard
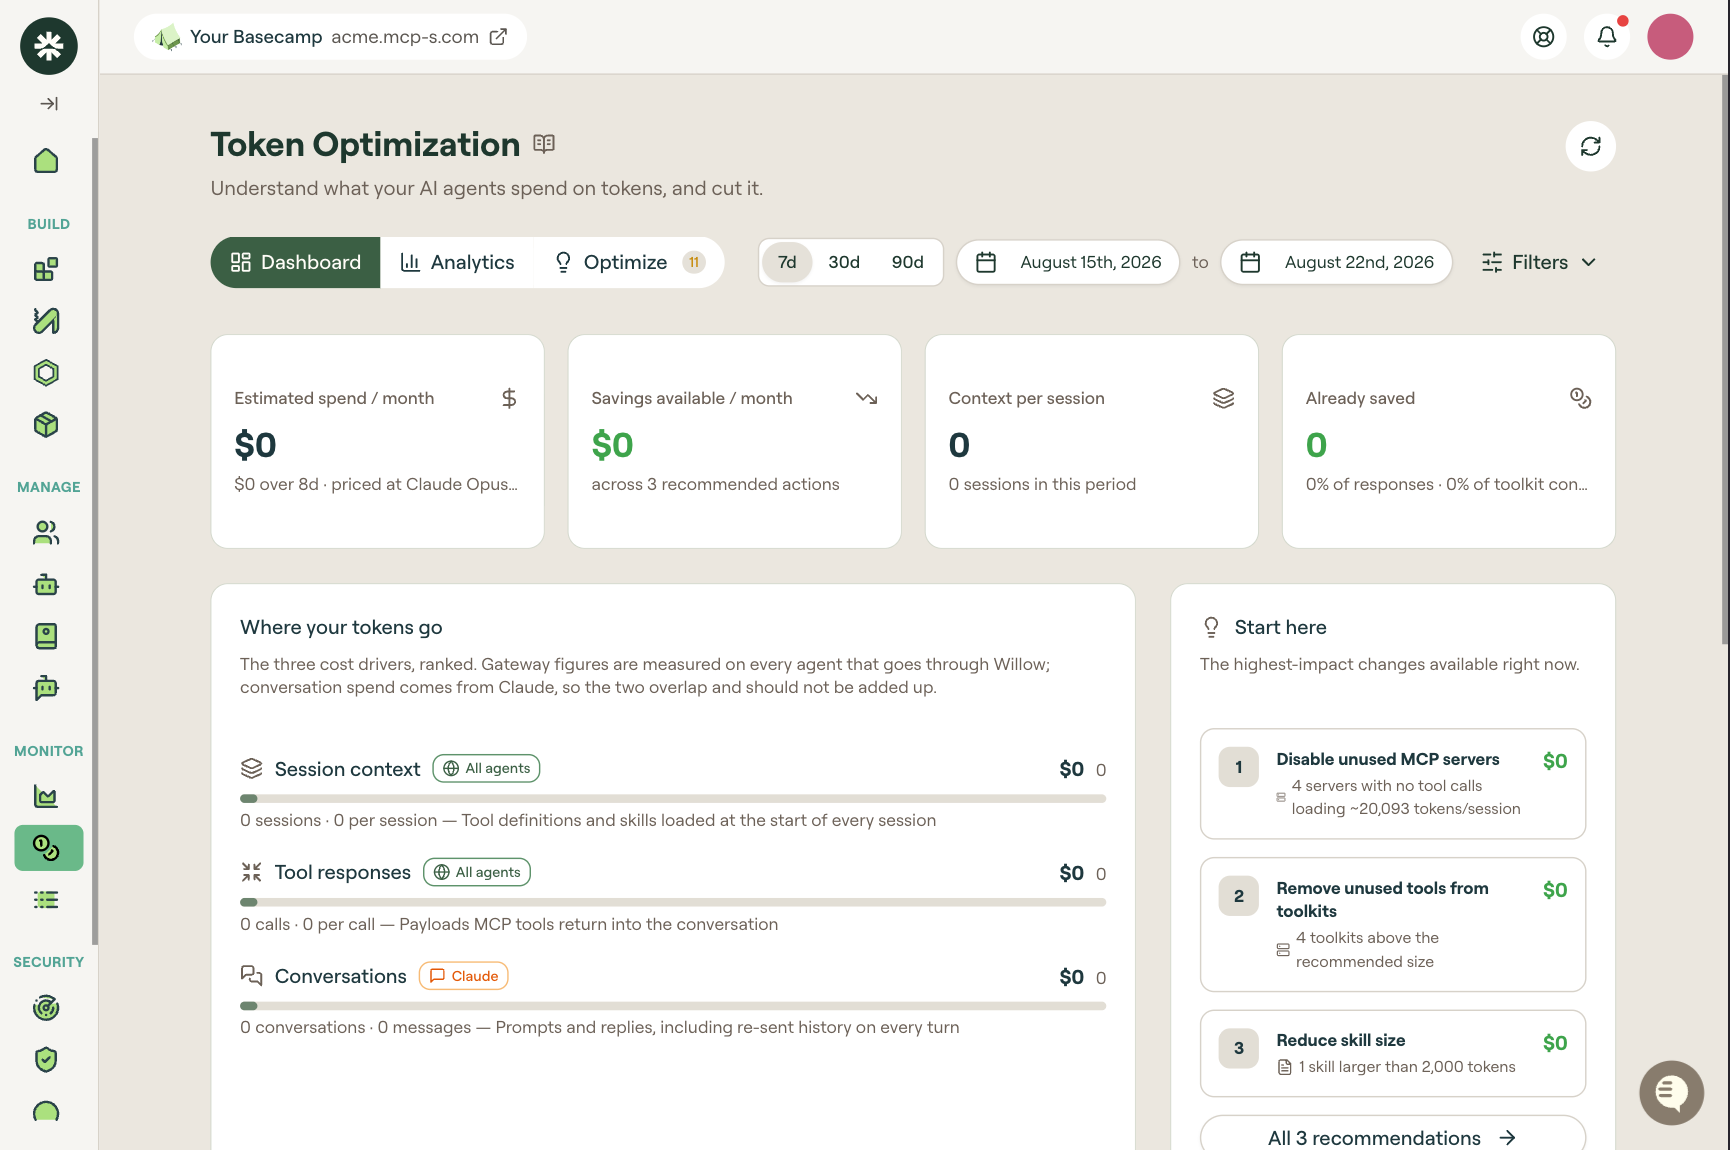
The Dashboard answers two questions: how much is this costing, and which single change would save the most? It opens with four cards:
| Card | What it shows |
|---|---|
| Estimated spend / month | Your projected cost for one month. Below the figure, the card shows the spend Willow measured and the date range it measured. It also names the AI model whose prices Willow used for the calculation. |
| Savings available / month | The total estimated saving across the current recommended actions. |
| Context per session | Average session context tokens loaded per session, with the number of sessions in the date range. |
| Already saved | The tokens your existing optimizations have prevented, shown as a percentage of response tokens and as a percentage of toolkit context tokens. |
Willow calculates every dollar figure on this page. They are estimates, not amounts anyone has charged you. See The dollar figures are estimates, not a bill.
Where your tokens go
This panel lists the three cost drivers, most expensive first. For each driver it shows the cost, how much of it there was, and a one-line definition.
| Driver | Numbers shown | What it is |
|---|---|---|
| Session context | Number of sessions, and tokens per session. | The tool definitions and skills that load at the start of every session. |
| Tool responses | Number of calls, and tokens per call. | The data that MCP tools send back into the conversation. |
| Conversations | Number of conversations, and number of messages. | Prompts and replies, including the earlier messages sent again with every new prompt. |
The Session context and Tool responses rows show an All agents tag, because the gateway measures them for every AI agent. The Conversations row shows a Claude tag, because Claude reports that spend.
Some of the same tokens are counted by the gateway and reported by Claude. If you add Session context + Tool responses + Conversations, you count those tokens twice and the total is too high. Compare the three drivers against each other to decide what to fix first, and use each figure on its own.
Start here
This panel lists the changes that would save the most right now, in order, each with its estimated monthly saving. A button labelled All n recommendations, where n is the number of recommendations you have, opens the full list on the Optimize view.
Estimated spend over time
This chart shows conversation cost per day, calculated using the prices of the AI model named on the Estimated spend / month card. The chart covers conversation spend only. It does not include gateway traffic.
Context health
These four cards compare your usage with the token budgets Willow recommends. Each card shows a total and the number of items that are above the recommended budget.
| Card | What it measures |
|---|---|
| MCP Context | How many tokens your tool definitions use, added up across all your MCP servers. |
| Toolkits | How many tokens the tools in each toolkit use, added up across all your toolkits. |
| Skills | How many tokens your skills load into each conversation. |
| Tool Responses | The average tokens per call, across your tools. |
Analytics
Analytics shows the detailed numbers, in three tabs grouped by where the data comes from.
MCP Gateway
This tab covers the traffic that passed through the Willow gateway. It has four cards above two charts.
| Card | What it shows |
|---|---|
| Response tokens | Tokens in the data that tools sent back. |
| Init context tokens | Tokens of session context loaded at the start of sessions. |
| Avg tokens / call | Average tokens used by one tool call. |
| Saved by mapping | Tokens that response mappings removed, shown as a percentage of the tokens the tools originally returned. |
| Chart | What it shows |
|---|---|
| Tool Token Usage | Tokens in requests, tokens in responses, and tokens in the raw responses before Willow processed them. Subtract the response tokens from the raw response tokens: the difference is what your response mappings removed. |
| Toolkit Context Savings | Compares two numbers: the session context tokens your toolkits actually used, and the tokens it would have cost to load every tool from every MCP server. |
Conversations
This tab shows the conversation spend that Claude reports. It has four cards above three panels.
| Card | What it shows |
|---|---|
| Estimated spend | Estimated cost of the conversations in the selected date range. |
| Conversation tokens | Tokens sent to the model, and tokens returned by it. |
| Conversations | Number of conversations, and the total number of messages in them. |
| Avg messages / conversation | Average number of messages per conversation, plus the message count of your longest conversation. |
| Panel | What it shows |
|---|---|
| Biggest Spenders | Estimated conversation cost per user. |
| Used Models | Estimated cost by model, with each model priced at its own rate. |
| Messages per Conversation | How many conversations had each length. Every new prompt in a conversation resends all the earlier messages, so each prompt in a long conversation costs more than the one before it. |
Devices
This tab shows AI agent token usage collected from managed devices instead of from the gateway. Use it to see what agents cost on developer machines. It includes activity that never passes through the gateway.
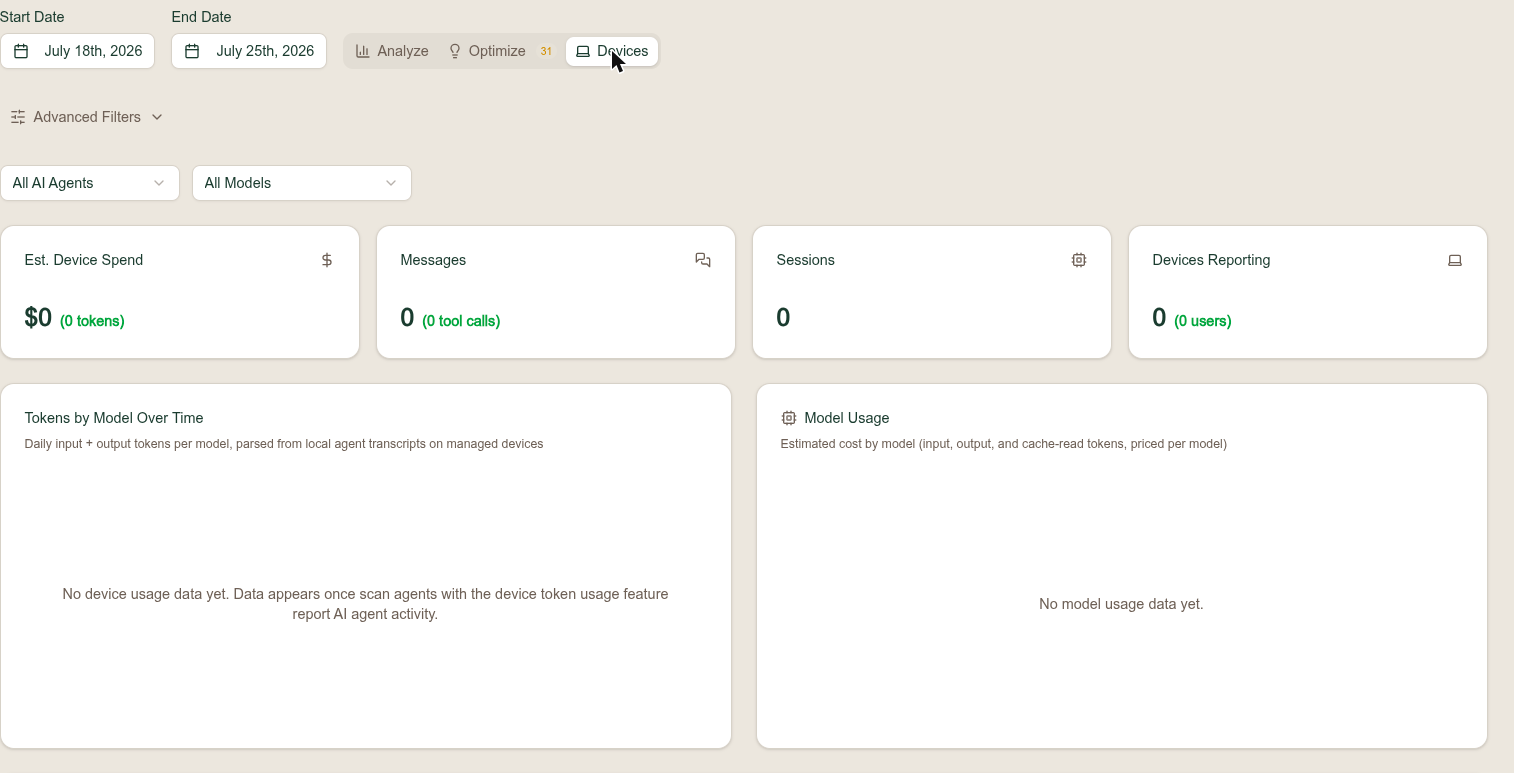
Two filters narrow this tab by AI agent and by model. Four cards show:
- estimated spend on devices
- the number of messages, and the number of tool calls those messages made
- the number of sessions
- the number of devices reporting, and the number of users those devices belong to
| Panel | What it shows |
|---|---|
| Tokens by Model Over Time | Daily input plus output tokens per model, read from local agent transcripts on managed devices. |
| Model Usage | Estimated cost, broken down by AI model. The cost includes tokens sent to the model, tokens returned by the model, and cached tokens the model reread. Each model is priced at its own rate. |
| Usage by User | Device-collected AI agent usage, attributed to organization users. |
| Usage by Device | Every managed device that reported AI agent token usage. |
AI Discovery scan agents send the data for this tab. The gateway does not. Until your scan agents report AI agent activity, these panels stay empty.
The Devices tab can be empty while the MCP Gateway tab has data. This is normal. The MCP Gateway tab shows traffic through the gateway. The Devices tab shows what scan agents see on managed machines. These are two different sources. Before you troubleshoot further, confirm that your scan agents are deployed and reporting.
Optimize
Use the Optimize view to make changes. It has three sections: recommended actions, usage policies, and the context inventory.
Recommended actions
A header shows Estimated total savings, which is the total for all the actions currently listed. The Output format control is at the top right of the section. See Output Format Optimization.
Each card contains the following:
| Element | What it is |
|---|---|
| Category tag | A label such as Context, showing what kind of problem this is. |
| Finding | The measurement that produced this recommendation. |
| Estimated monthly saving | How much Willow estimates this change would save each month. |
| Explanation | Why this problem costs you money. |
| Button | Opens the Willow page where you make the change. |
| Docs link | Opens the documentation for this change. |
| How to toggle | Expands to show numbered steps. |
The cards you see depend on your own usage. These are the most common ones:
| Recommendation | Why it helps |
|---|---|
| Disable unused MCP servers | An MCP server loads every one of its tool definitions into the context of every session, even when no agent calls those tools. If a server uses a large number of context tokens but had no tool calls in the selected date range, you are paying for it and getting nothing back. |
| Remove unused tools from toolkits | A toolkit may still include tools that nobody uses. Those unused tools add context tokens to every session that loads the toolkit. |
| Reduce skill size | Willow loads your skills into every conversation. Make large skills shorter, and move the detail into separate files that the agent reads only when it needs them. This lowers the token cost of every session. |
Before you disable a server, widen the date range and check Analytics for tool calls. Some servers are only used once a quarter or once a year. A server that shows no calls in a 7-day range may still be in use.
Context inventory
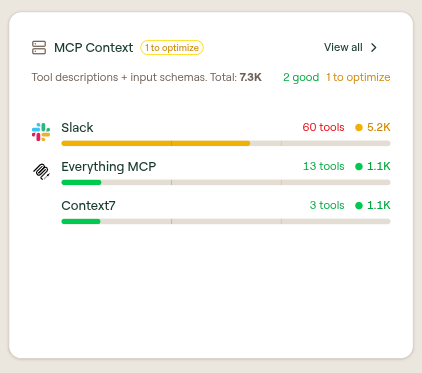
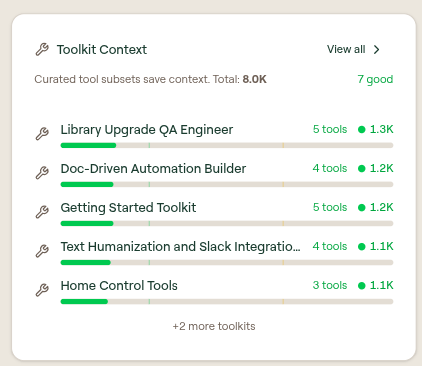
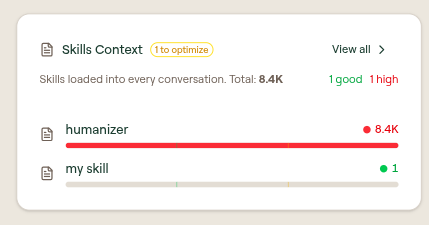
These four cards show what is loaded into context, ranked by the number of tokens used. Each card shows:
- a total token count
- how many items are
good,to optimize, orhigh - the individual items that use the most tokens, with their token counts
- a View all action
MCP Context
This card covers the tool descriptions and input schemas loaded from your MCP servers. Selecting it opens MCP Context. Open that page when one MCP server has many tools, or when its tool descriptions and input schemas use a lot of tokens.
Toolkit Context
This card covers the context that your toolkits load. Selecting it opens Toolkit Context. Use that page to compare toolkits, and to find toolkits you should split into smaller ones or remove tools from.
Skills Context
This card covers the skill content that loads into every conversation. Selecting it opens Skill Token Analysis. Open that page when a single skill is large enough to raise the token cost of every conversation that loads that skill.
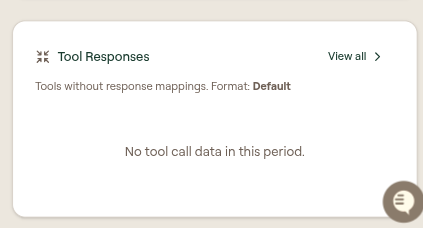
Tool Responses
This card covers tool outputs and the places where a response mapping could help. Selecting it opens Tool Response Optimization. Open that page when your tool outputs need response mappings or a different output format.
Empty states
Parts of the page can show no data. This happens when Willow has not recorded enough activity in the date range you selected. If a panel is empty:
- widen the date range
- clear the filters
- run tool calls through a connected AI client
- confirm Token Usage Analytics is enabled
- for Conversations, confirm conversation data is syncing from Claude
- for Devices, confirm scan agents are deployed and reporting