Dashboard
The dashboard is the landing page of the admin app. It greets you by name and summarizes AI usage and security posture across your organization.
Two tabs split the view: AI Adoption and Security. The subtitle and the panels change with the tab, but the metric cards and the two strips beneath them stay in place on both. A sliders icon customizes which metric cards are visible, and Refresh re-fetches the data.
The shared header
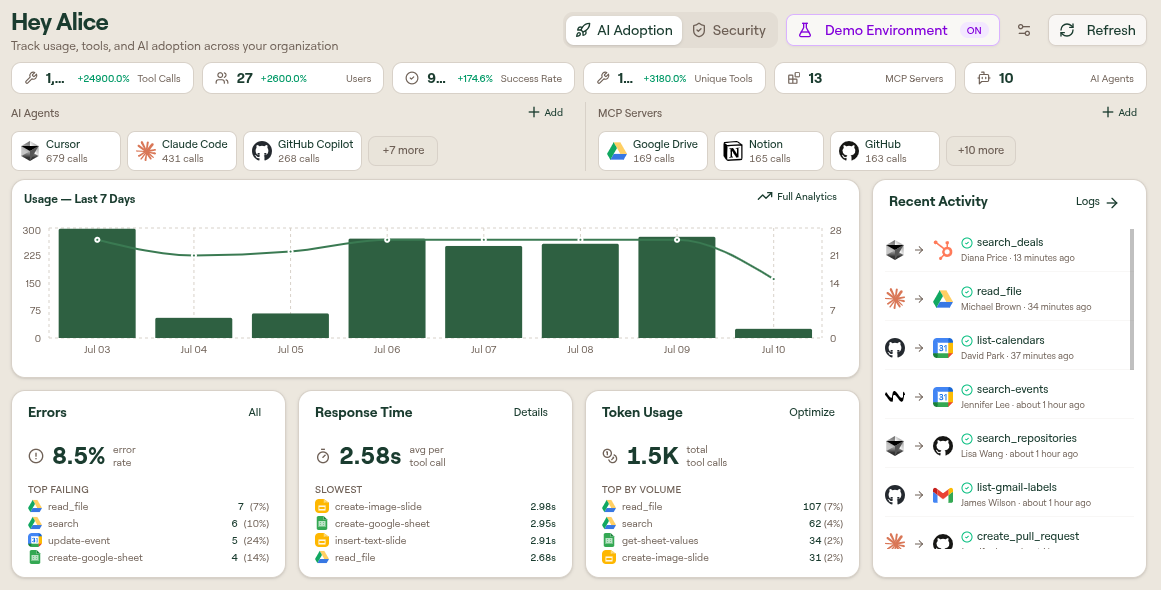
Metric cards across the top show Tool Calls, Users, Success Rate, Unique Tools, MCP Servers, and AI Agents, each with the change over the selected period.
Below them, an AI Agents strip and an MCP Servers strip rank the most-used of each by call volume. Add opens AI Tools or MCP Servers respectively, and +N more opens the same page to show the rest.
AI Adoption
| Panel | What it shows |
|---|---|
| Usage — Last 7 Days | Tool calls and active users over time. Full Analytics opens Analytics. |
| Recent Activity | The latest tool calls, with the AI agent, the MCP server, the tool, and who ran it. Logs opens Monitor Logs. |
| Errors | The error rate, plus a Top failing list naming each tool, its failure count, and its failure rate. All opens Analytics. |
| Response Time | Average duration per tool call, plus a Slowest list. Details opens Analytics. |
| Token Usage | The tool calls measured and a Top by volume list of the tools consuming the most tokens. Optimize opens Settings. The token optimization controls themselves now live on Monitor > Tokens; see Output Format Optimization. |
Security
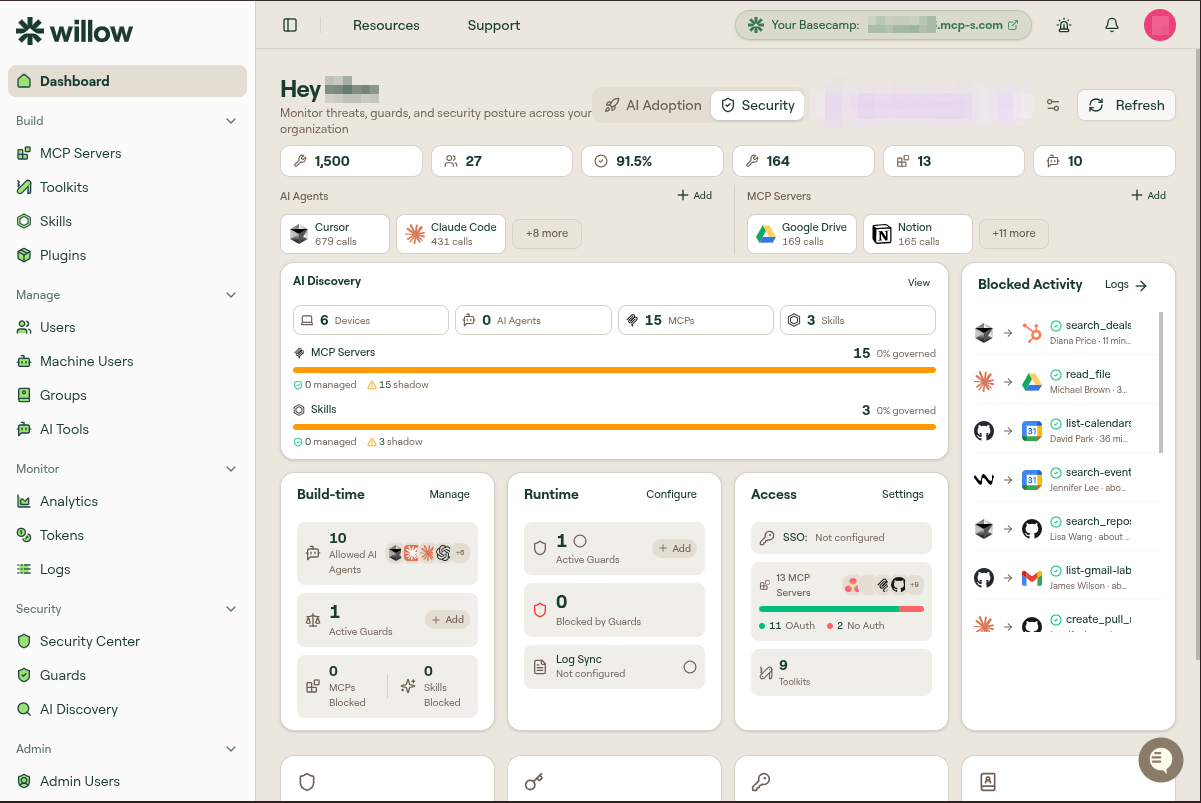
The Security tab answers a different question: what is unmanaged, and what is being stopped.
| Panel | What it shows |
|---|---|
| AI Discovery | Counts of devices, AI agents, MCPs, and skills found on developer machines. Beneath them, a managed-versus-shadow bar and a % governed figure for MCP servers and for skills, then a Risk strip summarizing guard coverage and the AI risk breakdown. View opens AI Discovery. |
| Blocked Activity | Recent tool calls stopped by a guard, naming the tool and the user. Logs opens Monitor Logs. |
| Build-time | Allowed AI agents, active build-time guards, and how many MCPs and skills are blocked. |
| Runtime | Active runtime guards, how many calls they blocked, and whether Log Sync is configured. |
| Access | Whether SSO is configured, how many MCP servers use OAuth versus no auth, and the toolkit count. |
Build-time, Runtime, and Access each link to the page that configures them, through Manage, Configure, and Settings respectively. The counters inside them are links too: Active Guards opens the matching tab of Guards, and Log Sync opens Log Settings.
Resources
A strip of documentation cards sits at the foot of both tabs, and its contents follow the tab you are on. AI Adoption offers MCP Servers, Toolkits, Machine Users, and GitHub Integration; Security offers Guards, Vault, JWT Passthrough, and SCIM Provisioning. Browse all tutorials and documentation opens the documentation home.
Demo data
A Demo Environment toggle sits in the header. Switch it on and the dashboard fills with representative devices, tool calls, and discovered capabilities, so you can see the product populated before your own data arrives. Switch it off to return to your real numbers.