Logs
The Logs page is the audit trail for every request Willow handles: tool calls, client connections, connector authentications, and AI agent interactions. Use it to see exactly what an AI agent did, on whose behalf, against which MCP server, and whether a guard acted on it. Open it from Monitor > Logs.
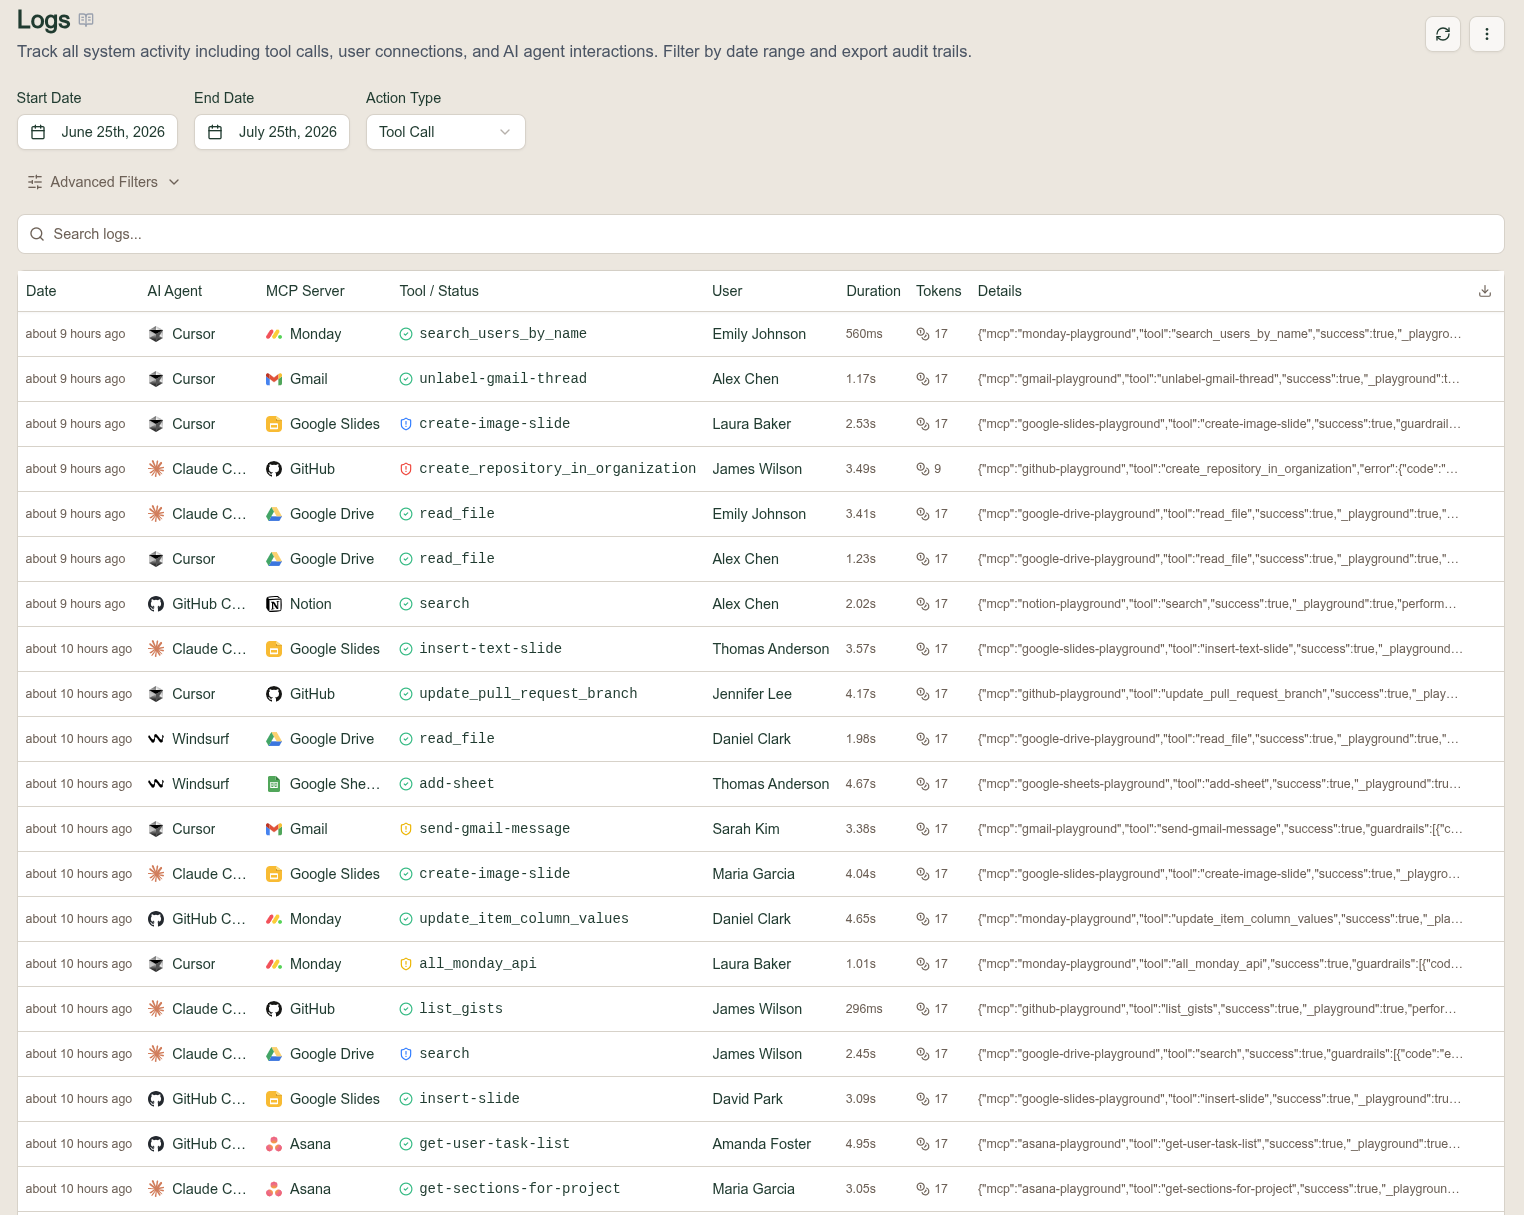
Filters
- Start Date and End Date set the window of activity to show.
- Search logs does a free-text search across the entries.
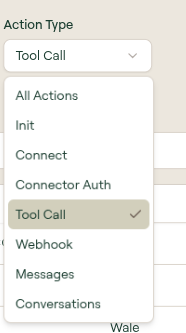
Action Type
The Action Type dropdown filters by the kind of event:
| Option | Event |
|---|---|
| All Actions | No filter; show every event type. |
| Init | Session initialization. |
| Connect | A client connecting to the gateway. |
| Connector Auth | An upstream connector authentication event, for example an OAuth completion. |
| Tool Call | A tool invocation. |
| Webhook | A webhook event. |
| Messages | A message exchanged with the agent, from any source: agent telemetry, guard hook evaluations, the browser extension, or a compliance sync. |
| Conversations | A conversation-level event. |
Source
With Action Type set to Messages, a Source selector appears alongside it. Every prompt and reply Willow collects lands in the same place, whichever pipeline reported it, and Source narrows the list to one of them:
| Source | Reported by |
|---|---|
| Telemetry | The agent's own OTLP telemetry (Claude Code, Codex, Cursor). |
| Guard Hook | A guard hook evaluation in an IDE or coding agent. |
| Compliance | The Claude compliance sync. |
| Extension | The browser extension's Prompt Guard on a web AI chat. |
A single prompt often reaches Willow twice — a Claude Code prompt is reported by both the hook evaluation and the OTLP export — and Willow stores it once, listing every source that contributed. Those rows show more than one source badge and match either Source value.
Advanced Filters
Select Advanced Filters to expand a row of additional selectors:
| Filter | Scopes results to |
|---|---|
| User | A specific user. |
| AI Agent | A specific client or agent. |
| MCP Server | A specific MCP server. |
| Tool | A specific tool. |
| Status | Outcome: All, Success, or Failed. |
| Guard Action | The action a guard took: All, Blocked, Warned, or Transformed. |
| Guard | A specific guard. |
The User, AI Agent, MCP Server, Tool, and Guard selectors are searchable lists populated from your organization's activity. The Guard Action and Guard filters are the fastest way to find events a guard acted on, for example every request that was Blocked.
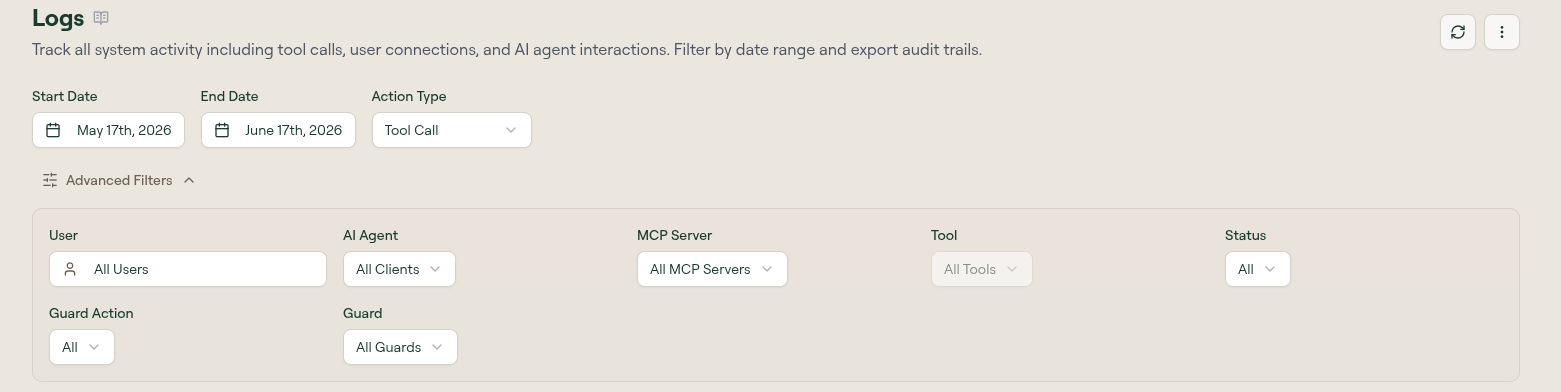
Table columns
The table supports search and sortable columns. Select a column header to toggle the sort order.
| Column | Description |
|---|---|
| Date | When the event occurred, shown as relative time (for example "10 days ago"). |
| Action | The event type, shown as an icon. Present only while Action Type is All Actions; filtering to a single type hides this column, since every row would carry the same value. |
| AI Agent | The client or agent that made the call (Cursor, Claude Code, VS Code, ChatGPT, and so on). |
| MCP Server | The MCP server involved. |
| Tool / Status | The tool that was called and whether it succeeded: a green check for success, a red ✗ for failure. |
| User | The user the call belongs to. |
| Duration | How long the call took (for example 735ms or 4.37s). |
| Tokens | Token count for the call. |
| Details | The full event payload. Select it to open the details modal. |
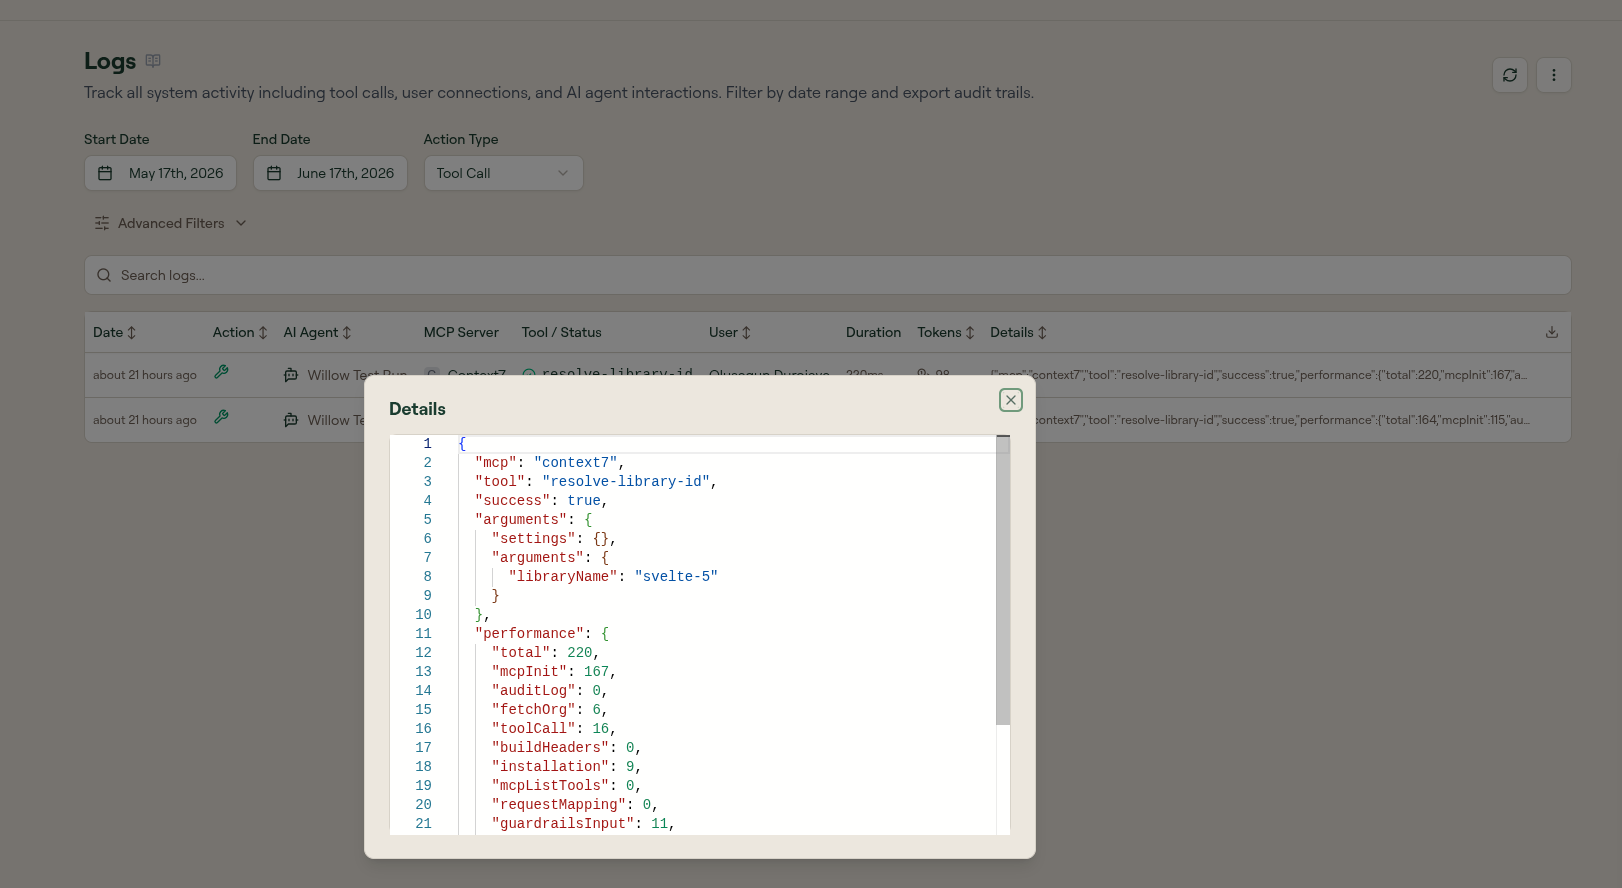
View log details
Hover a row and select the view (eye) icon, or select the row's Details, to open the Details modal: a scrollable, line-numbered JSON viewer showing the full event, including the MCP server and tool, arguments, the resolved user identity, the success flag, any guard decisions, and a performance breakdown.
Export logs
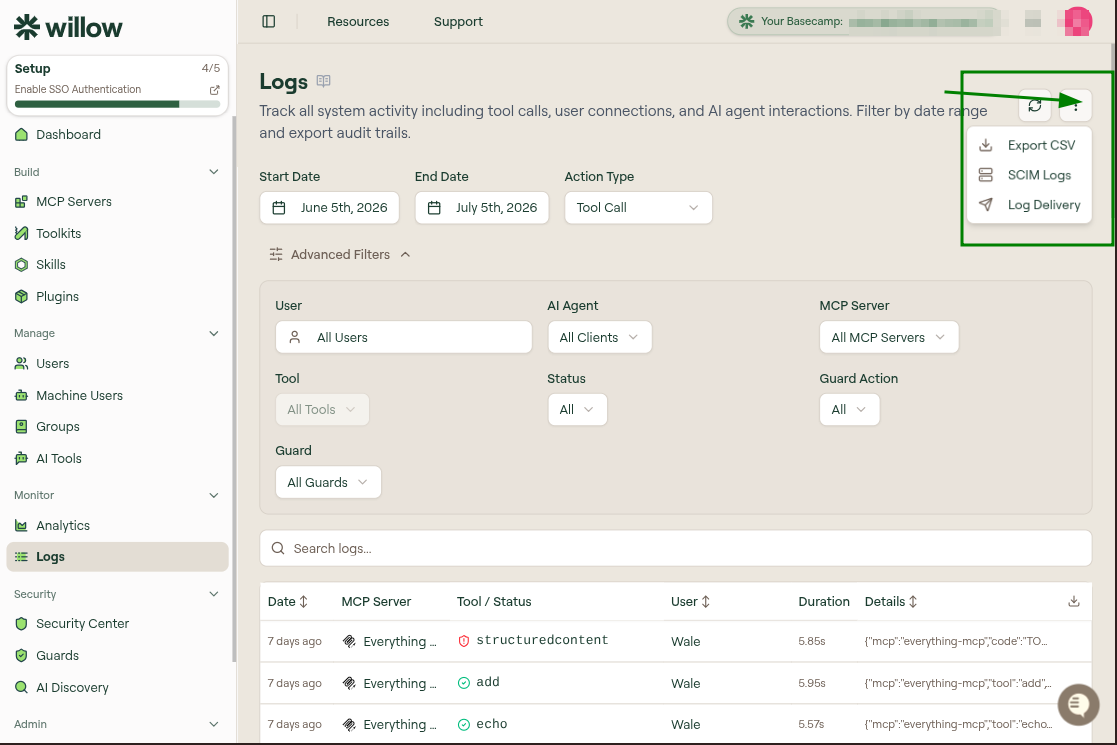
Select the overflow (three-dot) menu at the top right. It offers:
- Export CSV: download the currently filtered logs for compliance or analysis.
- SCIM Logs: jump to the SCIM Logs page for identity-provisioning events.
- Log Delivery: open the Log Delivery page to track delivery of audit logs to your external log providers.
What to do next
- Investigate with Logs: use these filters to diagnose common issues
- SCIM Logs: audit identity-provider provisioning operations
- Analytics: usage trends and performance metrics over time
- Radar: flagged security and operations gaps