Analytics Data Sources
Open Monitor > Analytics > Data sources to connect the sources that supply agent activity, skills, commands, and AI discovery data. Gateway activity appears automatically; agent telemetry and hook events require their own setup.
Start with the source card
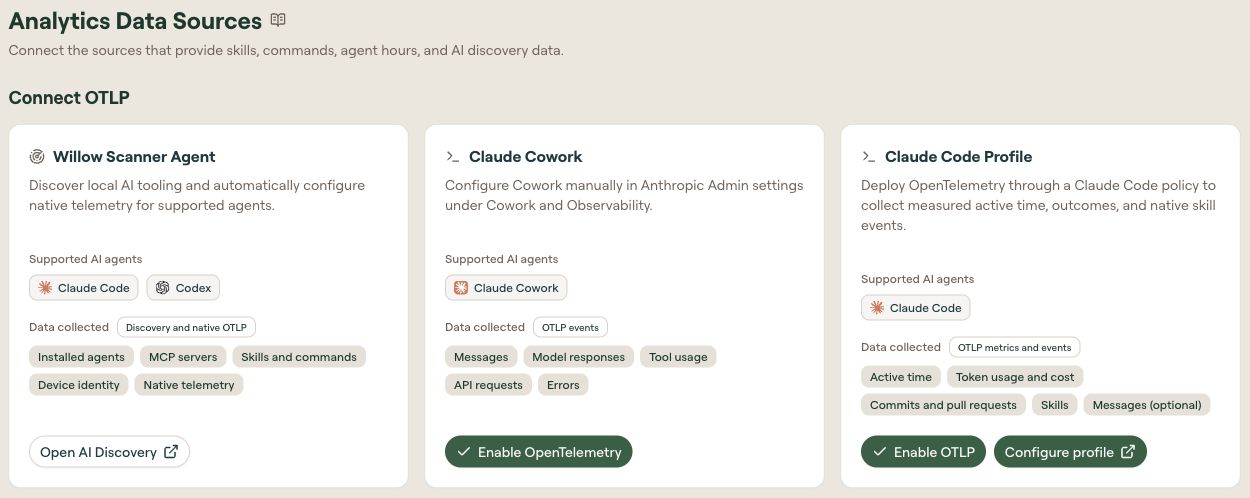
The page separates Connect OTLP from Enable hooks. Each card names the supported agents, the data it collects, and the action that opens its setup.
| Card | Data shown on the card | Where to start |
|---|---|---|
| Willow Scanner Agent | Installed agents, MCP servers, skills and commands, device identity, and native telemetry | Open AI Discovery |
| Claude Cowork | Messages, model responses, tool usage, API requests, and errors | Enable OpenTelemetry when shown; configure Cowork observability in Anthropic Admin settings |
| Claude Code Profile | Active time, token usage and cost, commits and pull requests, skills, and optional messages | Enable OTLP when shown, then Configure profile |
| Codex | Discovery, native telemetry, and guard decisions | Enable OTLP when shown; use the scanner or manual Codex configuration for telemetry and Open Guards for hooks |
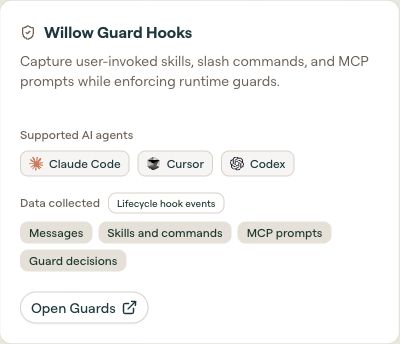
| Willow Guard Hooks | Messages, skills and commands, MCP prompts, and guard decisions | Under Enable hooks, select Open Guards |
If configuration instructions are missing
When OpenTelemetry is not enabled for the organization, the Cowork card shows Enable OpenTelemetry, and the Claude Code Profile and Codex cards show Enable OTLP. Start with the enable action on the source card before following its configuration instructions. Opening the Data Sources page alone does not configure an agent on a developer machine.
If you only see Overview on Analytics, open Data sources to check which sources still need setup. Explore and Dashboards also require ClickHouse to serve the organization; see Explore.
Configure a source
Willow gateway activity appears automatically. Add one or more sources for the other Analytics tabs:
- Claude Code OpenTelemetry (Claude Code): select Configure profile on the Claude Code Profile card, add the telemetry add-on to a policy, then export and deploy the policy. It sends OTLP metrics and events: active time, cost, tokens, commits, pull requests, and native skill events. Content capture for prompts, responses, tool details, and tool output is optional.
- Claude Cowork OpenTelemetry (Cowork): Cowork does not consume Claude Code policies. Open Monitor > Analytics > Data sources, then copy the endpoint,
http/jsonprotocol, and authentication header into Anthropic Admin settings > Cowork > Observability. It sends OTLP events including messages, model responses, tool usage, API requests, and errors. Save and start a new Cowork session. Cowork monitoring requires an Anthropic Team or Enterprise plan. - Codex OpenTelemetry (Codex): Codex does not consume Claude Code policies. Open Monitor > Analytics > Data sources, expand the Codex card's Configure Codex manually, and copy the
[otel]block (the org token is already baked in). It sends OTLP logs, metrics, and traces. Deploy it one of three ways:- Single machine: paste the block into
~/.codex/config.tomland restart Codex. - Team or organization (managed settings): distribute the same block as Codex managed settings — a
managed_config.tomlpushed via macOS MDM (thecom.openai.codexdomain, keyconfig_toml_base64), or written to/etc/codex/managed_config.toml(Linux/macOS) or%ProgramData%\OpenAI\Codex\(Windows). Managed defaults apply at launch and take precedence over the user's~/.codex/config.toml. Because users can override managed defaults mid-session, add a matching hook in the admin-enforcedrequirements.tomlif you need telemetry to stay on. - Automatically: let the Willow Scan Agent configure it for you (see below).
- Single machine: paste the block into
- Willow Guard Hooks plugin (Claude Code, Cursor, and Codex): open Security > Guards > Setup & Coverage, then select Set up Guard Hooks beside Claude Code, Cursor, or Codex, activate the plugin, choose its hooks, and deploy it through managed settings or your plugin marketplace. Hook events capture messages, user-invoked skills and commands, MCP prompts, and guard decisions. See Guard Hooks.
- Willow Scan Agent (Claude Code, Codex, and Cursor telemetry): deploy the agent to discover installed AI agents, MCP servers, skills, and commands on managed devices and automatically configure telemetry. For Claude Code and Codex it writes the native OTLP exporter config; Cursor has no native OTLP export, so the agent installs a Cursor lifecycle hook that buffers events locally and uploads them to Willow in batches (no per-event network call). Toggle each agent under Admin > Settings > Log Settings > Collect Agent Telemetry. To filter or enrich that telemetry before Willow stores it, enable OTLP proxy so agents send to your collector first. See Deploy the Scan Agent.
For local Claude Code testing, use Install for me when exporting a policy. For fleet deployment, use MDM or managed settings.
Hook events and telemetry
OpenTelemetry and Guard Hooks collect different kinds of events. Use the source cards to decide which data you need: native telemetry reports agent usage, while hooks capture lifecycle events and guard decisions.
Related
- Analytics: gateway metrics, filters, and exports
- Guard Setup & Coverage: connect guard enforcement to each surface
- Log Settings: control stored content and responses
- OTLP proxy: route telemetry through your collector